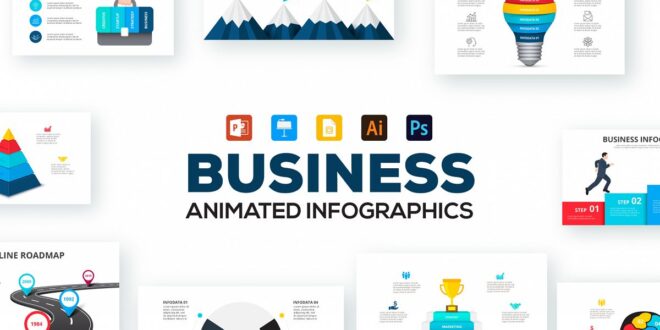
As you might already know, certain kinds of presentations can be an amazing way to awaken interest among customers, regardless of the product you’re selling or the business you’re promoting. But, what you definitely want to avoid in such cases is monotony and uniformity. Like in many life spheres – a little bit of creativity and some cool ideas might do wonders if you use them in a proper way. You’ve probably noticed that website owners don’t allow letter flooding, trying to make the graphic prevail. The reason for this is that people have always been guided by the old saying: ‘a picture is worth a thousand words’. And, well, we certainly know that you leave the web page in record time as soon as you notice that it’s simply cluttered with a bunch of letters as you’re bored of reading for so long. That’s where presentations enter the scene.
In this fast-paced world, people love both fast and clear information. And the best way to achieve this effect is by using interactive graphics, with less text, which speaks volumes. Thus, in business presentations, we strive for as many such displays as possible.
By not having infographics when informing people about your product or service, you only achieve a not-so-positive side effect. The possibility that the viewers might lose interest very quickly, or fall asleep in an even worse case, is quite big. By combining graphics and text when giving information, you get a perfectly concise form as attention will be focused on key stuff and the desired result will be achieved more simply.
In this way, you can quickly and easily reach the target audience and increase their awareness of what you have to offer. Also, you get the opportunity to encourage clients to share your presentation on social media with quality and educational content. And of course, this brings an even wider circle of potential customers.
A very powerful tool, right? The only thing that matters is being able to handle it. With this story, you’re about to learn the basics of creating such presentations. All you need fits easily in a few essential steps described below, so don’t miss the next few paragraphs.
Find out what your target audience is

The first thing to do before you start designing a projection concept is to determine exactly who to turn to. Defining which social group the product is adapted to is a key step before you continue thinking further.
Are they members of a certain gender, age, or religion? Or you just have to be careful about whether you’re addressing someone who’s experienced or someone who knows absolutely nothing about what you’re talking about? These are all details that need to be considered before proceeding with planning.
The data you want to visualize must reach the intended recipient. Why is this important? The fact is that the beginner will need more detailed conceptual theses and the introduction to the story. For an experienced listener it’ll be enough to hear only the news about it. You need to take care to keep the attention you need most.
Focus on the structure and diversity of the content and gather all the necessary data
The next step, once you have identified your target audience, is to collect and sort the material you need to make the presentation. Infographics imply textual and graphic data that should concisely tell the story of what’s presented to the viewers. Don’t neglect this step, because well-conceived work is a great guide to success.
The content you insert may be compiled by you and may point to certain facts. But it can also be a certain number of your personal conclusions or views on a given topic that you have created based on research. The use of other people’s sources is also permissible and welcome – just don’t forget to state in the text itself where the sources were taken from, in order to avoid committing plagiarism.
Concept effective and shorter subtitles and let your imagination run wild by designing and using illustrations, photos, different fonts and templates. Make it as interesting as possible, but without exaggerating – everything’s good as long as it’s moderate.
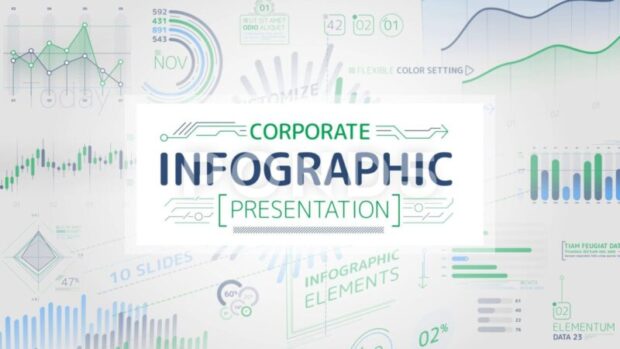
Choose the infographic template that suits you best
A great contribution to the compelling nature of slides is made by the right choice of templates. If you thought this was a point that goes unnoticed and shouldn’t be given that much importance, you are mistaken.
A good pattern affects the primary experience of the observer. Creating or downloading the one that fits the given topic best is crucial. In that way, you’ll also express your creativity, your efforts will be obvious and you’ll ‘catch the eye’ of the members of the audience.
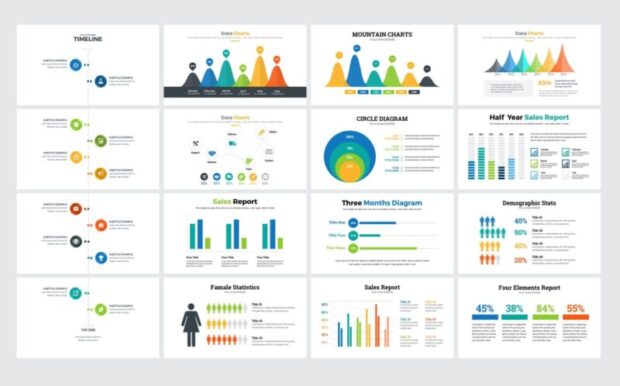
The template you choose should contain a flowchart, timeline, and other infographic elements that will credibly display the prepared content. With all these elements, you can achieve different things, such as highlighting the differences between the two terms, presenting linear or cyclical procedures but also illustrating the way the product works. They also enable the insertion of various statistical data as well as their graphical and tabular presentation.
Templates are mostly offered by Powerpoint or other programs, but you can also buy and download them. In online stores, you’ll find countless variously designed templates. Templatemonster.com teaches us that, if we know how to work in Photoshop, we can modify the downloaded templates ourselves, and we aren’t obliged to use the original ones.
Simpy said, we’re free to adapt them to our subject matter.
Use all infographic elements to complete the look
Once you’ve transferred your idea to the program and created the slides, it’s time to shape it all. Make sure the title is intriguing but that it specifically explains the topic.
Let the text be interactive, with lots of questions, so that those who watch can also participate in the presentation. This will keep them awake, and the questions will encourage them to identify themselves with the situations and problems that the product solves. Be creative with charts, play around trying to find out if the columns or pie charts are better. By combining colors, you’ll be able to separate differences, or emphasize what you want others to notice. Play with fonts, but don’t overdo it. Two styles will be enough and they won’t make the slides too ornate.
Don’t forget to find a place for your logo and links
Last but not least, leave space for your own resources and logo. So, if you have already invested so much effort, it would be time to advertise a little bit. Somewhere in the footer, leave a little space to place the logo of your company, as a project leader. Everything will look much more professional with that.
If a business presentation reaches a website, it will automatically become more visible to many more customers. However, in order for the spread to continue and encourage people to share your work with their acquaintances and friends via social media, it would be a good idea to leave a few links that lead to your other content and information sources.
You can trust us – it takes very little time to master these steps. Once you achieve that, you will have a particular skill that’ll turn into a useful asset in your future endeavours. By representing the given topic in the right way, the interest of new clients will be awakened, just like your position on the market. You won’t need a lot of time to create it, but you’ll save your employer or team from paying and hiring a special graphic artist. Good luck – you can do it!